
DEXA Scan Results Explained: What Your Numbers Mean
Your DEXA scan results come down to two key numbers: the T-score and the Z-score. The T-score compares your bone mineral density (BMD) to a healthy young adult’s peak bone mass. A T-score above -1.0 is normal. A score between -1.0 and -2.5 indicates low bone mass, often called osteopenia. A score at or below -2.5 meets the clinical definition of osteoporosis. According to MedlinePlus, these thresholds are the standard used to diagnose osteoporosis in postmenopausal women and men over age 50.
T-score thresholds at a glance:
- Above -1.0: Normal bone density
- -1.0 to -2.5: Low bone mass (osteopenia); fracture risk is elevated but often manageable with lifestyle changes
- At or below -2.5: Osteoporosis; clinicians typically discuss medication alongside lifestyle measures
Your single most important first step is to bring the printed report to your primary care provider or a bone health specialist. Ask specifically whether your clinician has calculated your FRAX score, which estimates your 10-year fracture risk and often determines whether treatment is recommended.
Key Takeaways
A T-score at or below -2.5 meets the clinical definition of osteoporosis, but fracture risk, FRAX probability, and the trend across serial scans matter as much as any single number.
| Point | Details |
|---|---|
| T-score thresholds | Above -1.0 is normal; -1.0 to -2.5 is low bone mass; at or below -2.5 is osteoporosis. |
| Z-score use | Z-scores apply to adults under 50 and flag secondary causes when below -2.0. |
| FRAX matters | T-score alone rarely determines treatment; FRAX combines BMD with clinical risk factors for a 10-year fracture probability. |
| Artifacts affect accuracy | Bone spurs, implants, and prior fractures can inflate spine scores; hip or forearm scores may be more reliable. |
| Garden State Medical Group | On-site bone density testing and follow-up care are available at North Bergen and Secaucus locations. |
Table of Contents
- What do DEXA scan results actually measure?
- How to read the numbers on your bone density report
- What your T-score means for fracture risk and clinical care
- When does the Z-score matter more than the T-score?
- Why your spine and hip scores can differ significantly
- What can throw off a DEXA scan’s accuracy?
- How your T-score and FRAX score work together to guide treatment
- How often should you repeat a bone density test?
- What to do after your DEXA: questions and first steps
- Treat your first DEXA as a baseline, not a verdict
- Bone density testing at Garden State Medical Group
- Sources
- FAQ
What do DEXA scan results actually measure?
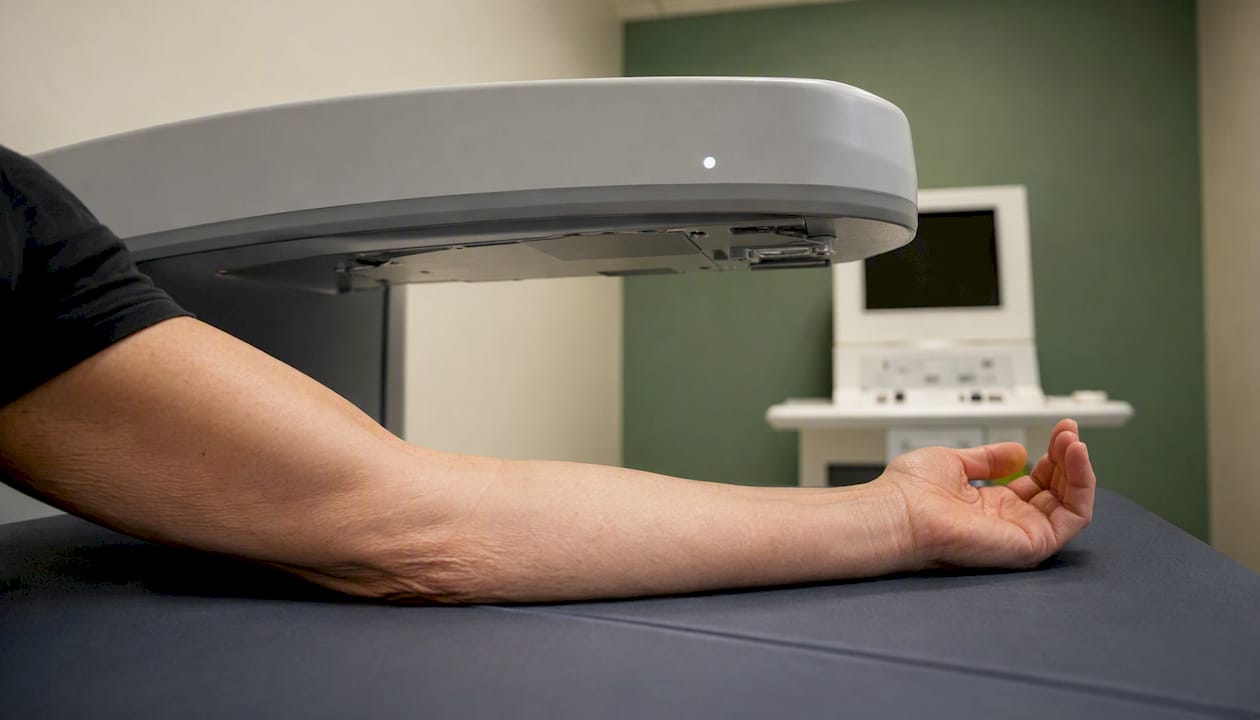
A DEXA scan, also written as DXA (dual-energy X-ray absorptiometry), is a low-dose X-ray that passes two low-energy beams through bone tissue. The scanner measures how much energy is absorbed, and from that calculates bone mineral density in grams per square centimeter (g/cm²). The test is more sensitive than a standard X-ray for detecting low bone density and uses a fraction of the radiation.
Most reports measure BMD at three primary sites:
- Lumbar spine (L1–L4): Captures trabecular bone, which responds quickly to hormonal and nutritional changes
- Femoral neck and total hip: Reflects cortical bone, which changes more slowly and is closely tied to hip fracture risk
- Forearm (distal radius): Ordered when hip or spine measurements are unreliable, or for patients with hyperparathyroidism
Clinicians order DEXA scans to diagnose osteoporosis, establish a baseline for future comparison, and estimate fracture risk. Many reports also include body composition data: total body fat percentage, lean mass, and visceral adipose tissue. The CDC notes that DEXA body-fat readings often differ from home scales because clinical DEXA captures visceral and intramuscular fat that consumer bioimpedance devices miss.
Pro Tip: Ask the technologist which sites were scanned and whether a forearm measurement was included. If your spine results are flagged as potentially unreliable, the forearm or hip score becomes the primary number your clinician will use.
How to read the numbers on your bone density report
Your report will typically show three types of values. Understanding what each one compares helps you ask better questions at your follow-up visit.
| Metric | What it compares | Used for |
|---|---|---|
| T-score | Your BMD vs. young adult peak bone mass | Diagnosing osteoporosis in adults over 50 |
| Z-score | Your BMD vs. age-, sex-, and ethnicity-matched peers | Evaluating younger adults; flagging secondary causes |
| BMD (g/cm²) | Absolute bone density at each measured site | Tracking change between scans over time |
Beyond these three, your report may include:
- Site-specific BMD values for each vertebra (L1, L2, L3, L4) and each hip region
- Total body fat percentage and regional fat distribution
- Lean mass by body segment
- Visceral adipose tissue (VAT) area or volume, when a full body composition scan is performed
For adults over 50, the T-score drives the clinical diagnosis. For younger adults, premenopausal women, and children, the Z-score is the more meaningful number. RadiologyInfo explains that T-scores help determine whether treatment is required, while Z-scores can flag unexpected low bone density for age and prompt further testing.
What your T-score means for fracture risk and clinical care
The T-score categories are not arbitrary. They reflect the relationship between bone density and fracture probability. Each one-standard-deviation (1-SD) drop in BMD is associated with roughly double the risk of a fragility fracture, according to MedlinePlus. That relationship is why clinicians take even moderate T-score changes seriously.
Here is how each category typically translates into clinical action:
- Normal (above -1.0): Routine monitoring, calcium and vitamin D optimization, weight-bearing exercise
- Low bone mass / osteopenia (-1.0 to -2.5): Lifestyle measures are the first line; repeat DEXA in 1–2 years; medication considered only when overall fracture risk is high
- Osteoporosis (at or below -2.5): Clinicians discuss prescription medication alongside lifestyle changes; FRAX calculation is standard
One SD drop in BMD roughly doubles fragility fracture risk. This is why a T-score of -2.5 carries meaningfully more risk than -1.5, even though the numbers look close on paper.
One nuance worth knowing: the clinical labels are threshold conventions, not absolute walls. Harvard Health points out that the fracture mechanics difference between a T-score of -2.3 and -2.5 is small. What matters more is the trend over time and your overall fracture risk profile.
When does the Z-score matter more than the T-score?
The Z-score compares your bone density with people of the same age, sex, and ethnicity. A Z-score of 0 means you are exactly at the average for your peer group. A score below -2.0 is considered significantly low for your age.
The Z-score takes priority in these situations:
- Premenopausal women (T-score thresholds were not designed for this group)
- Men under age 50
- Children and adolescents
- Anyone with an unexpectedly low T-score who has no obvious clinical risk factors
When a Z-score falls below -2.0, clinicians typically look for secondary causes of bone loss rather than attributing the result to aging alone. NIAMS/NIH identifies common secondary causes as medication side effects (steroids, anticonvulsants, certain cancer treatments), endocrine disorders such as hyperparathyroidism or celiac disease, and nutritional deficiencies including vitamin D and calcium.
Pro Tip: If your Z-score is below -2.0, ask your clinician whether blood tests are warranted to rule out a secondary cause. A medication review is also worth requesting, since several common drugs can accelerate bone loss.

Why your spine and hip scores can differ significantly
Spine and hip scores often diverge, sometimes by a full standard deviation or more. That gap is not a measurement error; it reflects real differences in bone biology and local factors at each site.
Key differences between sites:
- The lumbar spine is rich in trabecular bone, which is metabolically active and responds faster to hormonal shifts, nutritional changes, and treatment
- The hip contains more cortical bone, which changes more slowly and is a stronger predictor of hip fracture risk in older adults
- The forearm is measured when hip or spine readings are unreliable
When spine scores look better than hip scores in an older adult, clinicians often investigate local factors that can artificially inflate the spine reading:
- Degenerative joint disease or bone spurs at the lumbar vertebrae add density to the scan without reflecting true bone strength
- Aortic calcifications overlying the spine can be read as bone tissue
- Prior vertebral fractures or surgical hardware at the lumbar level distort the measurement
In these cases, providers typically rely on the hip score or the forearm score for diagnosis and treatment decisions. If adjacent vertebrae show large differences in individual BMD values (for example, L2 reads -2.8 while L3 reads -1.1), that inconsistency is a signal worth flagging with your clinician. You can read more about how equipment and positioning affect readings in Garden State Medical Group’s overview of bone density machines and their technical factors.
What can throw off a DEXA scan’s accuracy?
DEXA is accurate and reproducible when performed correctly, but several factors can bias the result in either direction. Knowing them helps you have a more informed conversation with your radiology team.
Common sources of error or artifact:
- Metallic implants (hip prostheses, spinal hardware, pacemakers) in or near the scan field inflate local BMD readings
- Prior vertebral fractures compress the vertebral body and increase apparent density at that level
- Spinal osteoarthritis and bone spurs add calcified tissue that the scanner reads as bone
- Severe obesity can push the body outside the scanner’s calibration range, reducing accuracy
- Incorrect positioning during the scan changes the geometry of the measurement area
- Recent nuclear medicine scans or contrast studies may interfere with scan quality if performed within 24–48 hours
A large difference between adjacent vertebrae (more than 1.0 SD) is a red flag. It suggests a local artifact rather than a true bone density difference and should prompt your clinician to exclude that vertebra from the average or order an alternate measurement site.
On safety: the NHS confirms that DEXA uses very low radiation, far less than a standard chest X-ray, making it safe for routine monitoring. For a practical checklist of what to tell your technologist before the scan, Garden State Medical Group’s guide on things to know before a bone density test covers common preparation questions.
How your T-score and FRAX score work together to guide treatment
A T-score alone rarely determines whether medication is prescribed. Clinicians combine it with the FRAX tool, a validated calculator developed by the World Health Organization that estimates your 10-year probability of a major osteoporotic fracture (spine, hip, forearm, or shoulder) and your 10-year probability of a hip fracture specifically.
FRAX incorporates your BMD alongside clinical risk factors:
- Age and sex
- Body mass index
- Prior fragility fracture
- Parental history of hip fracture
- Current smoking status
- Glucocorticoid (steroid) use
- Rheumatoid arthritis diagnosis
- Secondary causes of osteoporosis
- Alcohol use (three or more units per day)
A practical example: two patients both have a T-score of -2.2 at the femoral neck. Clinical guidelines in the United States, as summarized by NCBI, generally recommend treatment when the 10-year hip fracture probability exceeds 3% or the major fracture probability exceeds 20%. Patient A may be managed with lifestyle measures and monitoring; Patient B is likely a candidate for medication.
Pro Tip: Bring a complete medication list, your fracture history (including any “minor” wrist or rib fractures), and your smoking and alcohol history to your follow-up visit. FRAX is only as accurate as the information entered into it.
How often should you repeat a bone density test?
Monitoring intervals depend on your current T-score, your risk factors, and whether you are on treatment. There is no single answer that fits every patient, but general guidance gives a reasonable framework.
Typical repeat scan intervals:
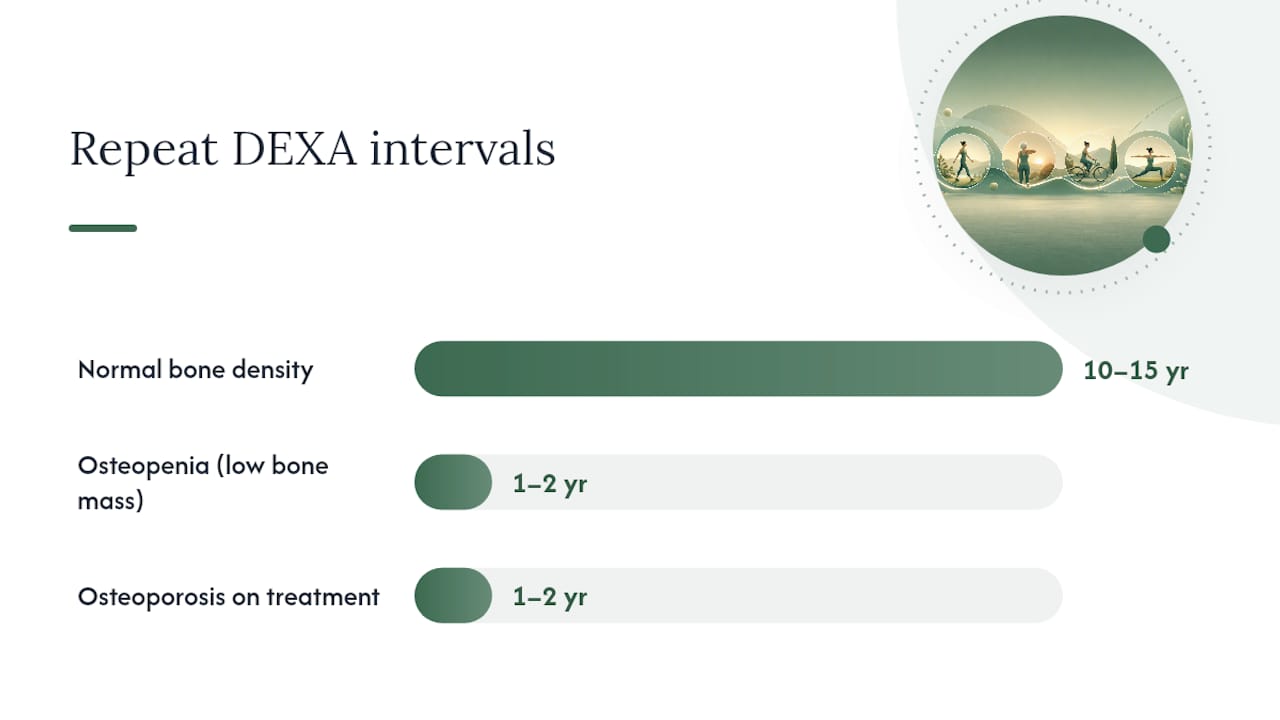
- Normal bone density: Every 10–15 years for low-risk individuals; sooner if new risk factors emerge
- Osteopenia (low bone mass): Every 1–2 years, or as directed by your clinician
- Osteoporosis on treatment: Every 1–2 years to assess treatment response
- High-risk situations: Earlier repeat scanning is appropriate after a new fracture, a new medication known to affect bone (steroids, aromatase inhibitors), or significant rapid weight loss
One concept that often surprises patients is the least significant change (LSC), also called precision error. Every DEXA machine has a small margin of measurement variability. A change in BMD between two scans is only considered clinically real if it exceeds that machine’s LSC, typically around 2–4% at the spine and hip. A small apparent change of 1% between scans may be measurement noise rather than true bone loss or gain. Your clinician or the radiology report should note whether any observed change exceeds the LSC for that facility.
Patient-facing guidance from Moonshot Medical recommends treating the first scan as a baseline and using serial scans to identify trends, which is the clinically sound approach to deciding whether to adjust treatment.
What to do after your DEXA: questions and first steps
Walking into a follow-up appointment with specific questions makes the visit more productive. Here is a numbered list you can bring with you:
- Which site (spine, hip, or forearm) is most reliable for my results, and why?
- Has my FRAX score been calculated, and what does it show?
- Does my Z-score suggest I need blood tests to rule out a secondary cause?
- What is my monitoring schedule, and when should I repeat the scan?
- Is medication recommended now, or are lifestyle measures the first step?
While you wait for that appointment, several evidence-based steps are worth starting immediately:
- Weight-bearing and resistance exercise: Walking, jogging, dancing, and strength training all stimulate bone formation. Safe, targeted options for people with low bone mass are outlined in these osteoporosis exercise guidelines.
- Calcium and vitamin D: Most adults need adequate daily calcium and vitamin D intake; typical recommendations suggest calcium from food and supplements combined, plus vitamin D, with amounts adjusted based on blood levels. Review foods that support bone density for practical dietary targets.
- Fall prevention at home: Remove loose rugs, improve lighting in stairways, and consider grab bars in the bathroom.
- Medication adherence: If you are already on a bone-building medication, consistent use is critical to seeing results on your next scan.
Before adding any new supplement, check with your clinician. Calcium supplements, for example, interact with certain thyroid medications and antibiotics, and high-dose vitamin D carries its own risks if blood levels are not monitored. For a broader lifestyle plan, Garden State Medical Group’s guide on keeping your bones strong covers the key pillars in patient-friendly detail.
Treat your first DEXA as a baseline, not a verdict
A single DEXA number does not define your bone health trajectory. What matters most is the trend across serial scans, interpreted alongside your full clinical picture.
Many people receive an osteopenia result and assume they are on an inevitable path toward osteoporosis. That is not how bone biology works. Harvard Health notes that the difference between a T-score of -2.3 and -2.5 is clinically small, and that lifestyle changes and targeted exercise can stabilize or improve BMD over time. The label matters less than what you do with the information.
A few reassuring points worth holding onto:
- Many people with osteopenia will never progress to osteoporosis, particularly with consistent exercise and adequate calcium and vitamin D
- Lifestyle changes are often the first and only intervention needed for borderline results
- Medication is a shared decision, not an automatic consequence of crossing a threshold
Your DEXA report is a tool for informed conversation with your clinician, not a sentence. Use it that way.
Bone density testing at Garden State Medical Group
Garden State Medical Group offers on-site bone density testing and radiology services at its North Bergen and Secaucus, New Jersey locations, so you do not need a separate referral to a standalone imaging center. After your scan, the same multidisciplinary team that ordered it can review your results, calculate your fracture risk, and coordinate next steps, whether that means lifestyle counseling, specialist referral, or medication management through primary care.
Patients who receive their DEXA and follow-up care in one place tend to have fewer gaps between results and action. If you have received a bone density report and want a clinician to walk through what the numbers mean for your specific situation, contact Garden State Medical Group to schedule an appointment. Same-location diagnostics and care coordination are available for Medicare, Medicaid, and most major insurance plans.
Sources
These resources are written for patients and are suitable to share with your clinician or family members:
- Bone Density Scan: MedlinePlus Medical Test
- Clinical guideline / NCBI resource
- Bone Mineral Density Tests: What the Numbers Mean — NIAMS/NIH
- DEXA scan - NHS
Clinicians in practice also use the FRAX calculator (available at sheffield.ac.uk/FRAX) and specialty society guidelines from the National Osteoporosis Foundation and the American Association of Clinical Endocrinologists.
This article is general information, not a substitute for advice from a qualified doctor. Consult a qualified healthcare professional about your own circumstances before acting on anything here.
FAQ
How do you interpret DEXA scan results?
Your DEXA report uses T-scores to classify bone density as normal (above -1.0), low bone mass (-1.0 to -2.5), or osteoporosis (at or below -2.5). Clinicians combine that number with your FRAX fracture probability and clinical history before recommending treatment.
What is a normal bone density result for a 70-year-old woman?
A T-score above -1.0 is technically normal at any age, but many older women have scores in the osteopenia range (-1.0 to -2.5). What matters most at that age is the FRAX-calculated fracture risk alongside the T-score, not the T-score alone.
What can throw off a DEXA scan?
Metallic implants, bone spurs, spinal osteoarthritis, prior vertebral fractures, and incorrect positioning can all inflate or distort spine readings. When adjacent vertebrae differ by more than 1.0 SD, clinicians typically exclude the affected level or rely on hip or forearm scores instead.
Is a T-score of -3.5 serious?
A T-score well below the -2.5 osteoporosis threshold indicates significantly reduced bone density. At that level, fracture risk is substantially elevated, and most clinicians will discuss prescription medication alongside lifestyle measures rather than monitoring alone.
Recommended
- Bone Density Testing: Everything You Need to Know about It | Garden State Medical Group | Garden State Medical Group
- How to Know If You Should Take a Bone Density Test | Garden State Medical Group | Garden State Medical Group
- Bone Density Test | Diagnostics | Garden State Medical Group
- A Few Things You Need to Know About Bone Density Tests | Garden State Medical Group | Garden State Medical Group