
Spirometry Results: Why Test Quality, GLI, LLN, and Trends Matter
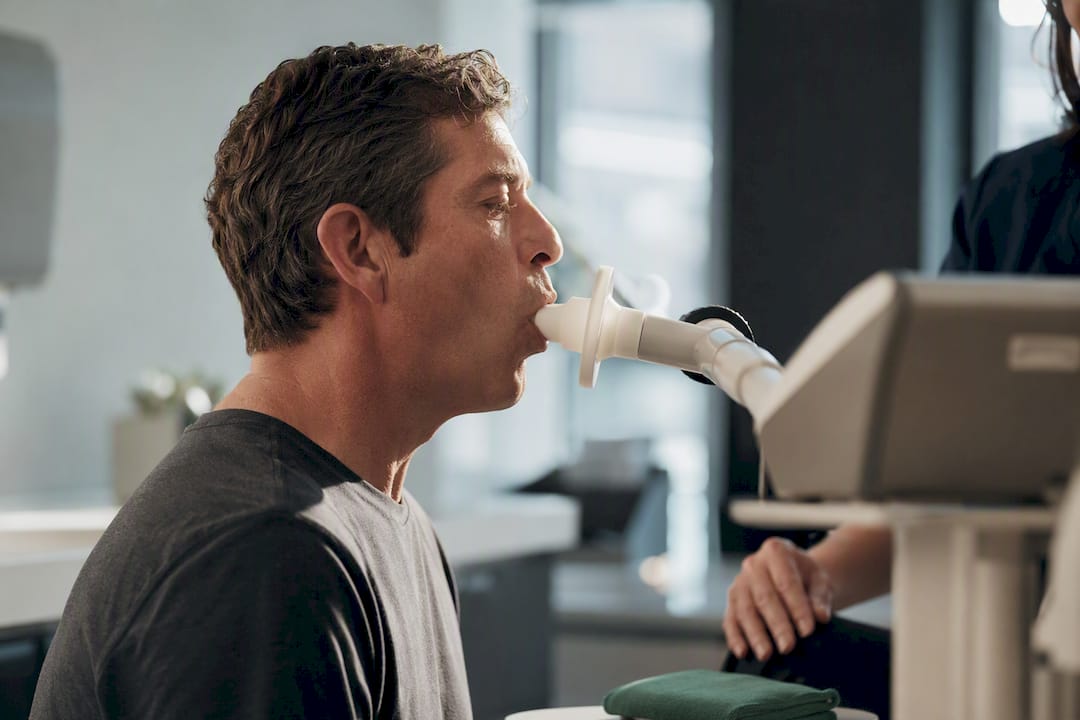
Your spirometry report centers on three numbers: FEV1, FVC, and the FEV1/FVC ratio, each compared against a predicted value for someone your age, height, sex, and ethnicity. That comparison sorts your results into one of three patterns: normal, obstructive, or restrictive. Before you read anything into the numbers, confirm the test itself was done well, then go over the findings with your provider.
TL;DR:
- Many patients are diagnosed with obstruction based on age-adjusted lower limits of normal, not fixed ratios, which prevents overdiagnosis in older adults.
- Proper test technique and reproducibility are crucial, as poor effort or technique often leads to unreliable results and misinterpretation.
- Lung volume testing and diffusing capacity are often necessary to confirm restriction or distinguish it from air trapping seen in obstruction.
- Trends over time in FEV1 and FVC provide more meaningful information for managing chronic lung diseases than single measurements.
- The choice of reference equations, like GLI, impacts interpretation accuracy, especially for patients over 65 or under 25; always verify which standards were used.
Table of Contents
- Understanding Spirometry Results: FEV1, FVC, and the Ratio
- How Are Normal Spirometry Values Calculated?
- How Do I Know If My Spirometry Test Was Done Correctly?
- Obstructive vs Restrictive vs Mixed: Reading the Pattern
- What Counts as a Positive Bronchodilator Response?
- How Severity Grading Works and Why Trends Matter More
- When You Need More Than a Spirometer vs Peak Flow Test
- What Happens During and After Your Spirometry Test
- How Garden State Medical Group Approaches Spirometry and Follow-Up Care
- Why Context Beats a Single Number Every Time
- Schedule Pulmonary Function Testing With Garden State Medical Group
- Sources
- FAQ
Understanding Spirometry Results: FEV1, FVC, and the Ratio
FEV1 stands for forced expiratory volume in one second. It measures how much air you can blast out of your lungs during the first second of a hard exhalation. FVC, or forced vital capacity, measures the total volume of air you can force out from a full breath in to a complete breath out. Together, they tell two different stories: FEV1 reflects how fast your airways let air escape, while FVC reflects how much air your lungs can hold and expel overall.
The FEV1/FVC ratio divides one by the other, and it’s the number pulmonologists look at first. A low ratio points to airway obstruction, since it means you’re pushing out a smaller share of your total lung volume in that first second, usually because something is narrowing your airways. Both FVC and FEV1 measurements get compared to age, height, sex, and ethnicity based predictions, and the ratio between them remains the single clearest signal of obstruction.
Your printout usually shows each value three ways:
- The raw measurement in liters (how much air, literally)
- Percent predicted, which compares your number to what’s expected for someone with your body characteristics
- A z-score, which tells you how many standard deviations you sit from the average for your demographic group
Statistic Callout: A ratio below the lower limit of normal for your demographic group, not a flat 0.70 cutoff, is the more accurate marker of obstruction, according to Global Lung Function Initiative reference data. Fixed thresholds tend to overdiagnose obstruction in older adults and underdiagnose it in younger ones.
Percent predicted gives you a quick gut check: a value near 100% suggests your lungs perform close to what’s expected for someone your size and age. Z-scores are more precise, because they account for the fact that normal lung function isn’t a single number but a range that shifts with age, sex, and height.
How Are Normal Spirometry Values Calculated?
Labs don’t compare your results to one universal standard. They plug your age, height, sex, and race or ethnicity into a reference equation that generates a personalized predicted value, then measure how far your actual result falls from that prediction. The most widely used equations today come from the Global Lung Function Initiative, often shortened to GLI.
Why does this matter so much? A 70-year-old man’s lungs naturally produce lower FEV1 and FVC values than a 25-year-old woman’s, even if both sets of lungs are perfectly healthy. Height matters too, since taller people generally have larger lung volumes. Older, fixed-percentage systems ignored these variations and applied the same cutoff to everyone, which routinely mislabeled healthy older adults as obstructed and missed early disease in younger patients.
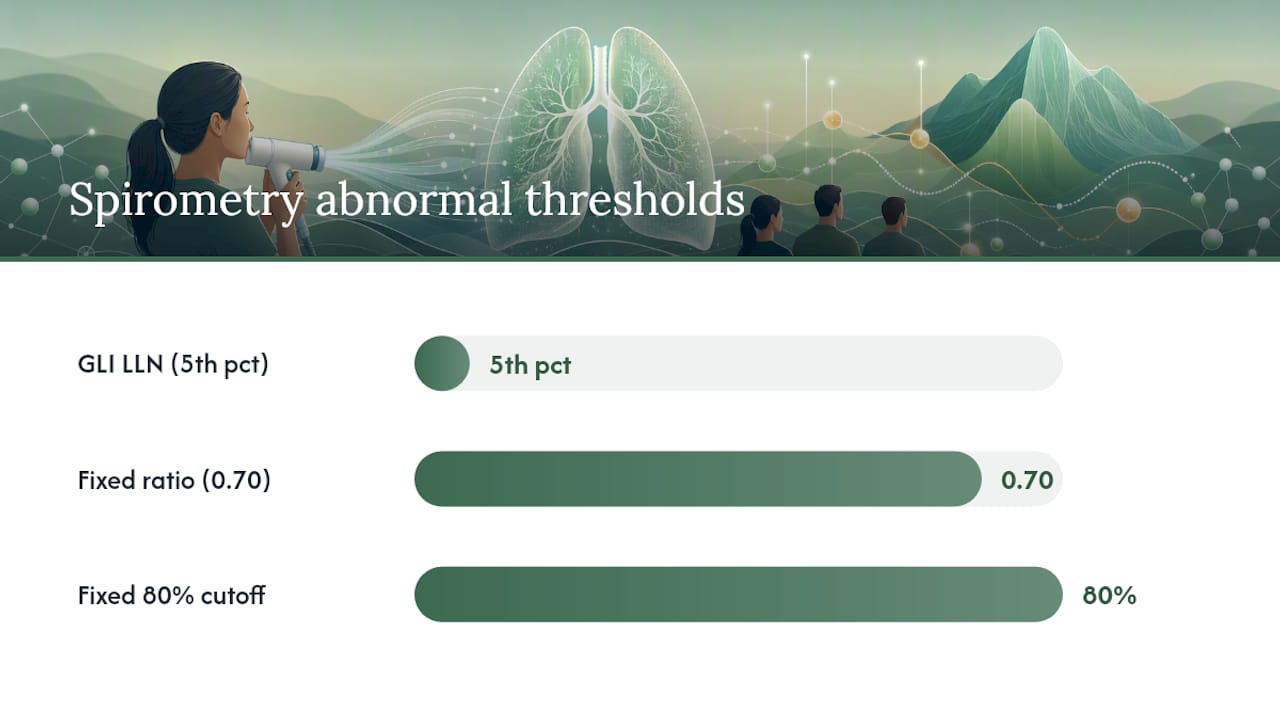
That’s where the lower limit of normal, or LLN, comes in. The LLN marks the bottom edge of the statistically normal range for your specific demographic profile, expressed as a z-score. Values that fall below the fifth percentile for people like you get flagged as abnormal, rather than being judged against everyone else’s lungs. The GLI 2012 equations generate these continuous predicted values and LLN thresholds across a wide range of ages and ethnic groups, replacing blunt cutoffs like FEV1/FVC below 0.70 or FEV1 below 80% predicted, both of which can misclassify patients whose lungs are aging normally.
- GLI equations adjust for age, height, sex, and ethnicity simultaneously
- LLN reflects the fifth percentile for your specific demographic group
- Z-scores let clinicians track subtle changes over time, not just pass/fail results
Pro Tip: Ask your lab or provider which reference equation generated your predicted values. If your report still uses a flat 80% or 0.70 cutoff instead of GLI-based LLN, ask whether your results should be reinterpreted with age-adjusted norms, especially if you’re over 65 or under 25.
How Do I Know If My Spirometry Test Was Done Correctly?
Numbers on a spirometry report only matter if the test itself was valid. Poor technique produces misleading results more often than any actual lung disease does, so quality control comes before interpretation, not after.
A technically acceptable spirometry session generally requires:
- At least three maneuvers that meet acceptability criteria, meaning you inhaled fully, blasted out air immediately and forcefully, and kept exhaling until your airflow essentially stopped.
- Reproducibility between your two best efforts, with the top two FVC and FEV1 values differing by no more than 0.2 liters.
- No disqualifying events during the maneuver, such as a cough in the first second, a slow start, an air leak around the mouthpiece, or stopping too early.
- If reproducibility isn’t achieved after multiple tries, up to eight attempts total before the session is considered unreliable and should be repeated another day.
Interpreting office spirometry depends heavily on confirming these acceptability and reproducibility standards were met before drawing any clinical conclusions. Inadequate patient effort remains the single most common reason spirometry tests come back invalid or inconclusive, more common than any equipment issue or underlying condition.
If your results look shaky, ask whether the technician flagged the test as acceptable and reproducible. A report that doesn’t meet these criteria isn’t necessarily wrong. It’s just not reliable enough to base decisions on.
Pro Tip: If you left your first test feeling like you couldn’t get a full breath out, or the technician stopped you early, ask for a repeat session with more detailed coaching before accepting the results as final. A few extra practice breaths often fixes the entire problem.
Obstructive vs Restrictive vs Mixed: Reading the Pattern
Interpreting spirometry test outcomes follows a fairly predictable sequence once you know what to look for.
- Step one: Compare your FEV1/FVC ratio to the lower limit of normal for your demographic profile. A ratio below the LLN signals an obstructive pattern, meaning something is narrowing your airways, as seen in asthma or COPD.
- Step two: Check your FEV1 and FVC percent predicted values. If the ratio is normal but both FEV1 and FVC are reduced together, that pattern suggests restriction, meaning your lungs can’t expand to a normal total volume, as can happen with interstitial lung disease or chest wall limitations.
- Step three: Watch for mixed patterns, where the ratio is low and both volumes are also reduced, indicating obstruction and possible restriction happening simultaneously.
One wrinkle worth knowing: severe air trapping from obstruction can artificially shrink FVC, producing what looks like restriction on spirometry alone. This is called pseudorestriction, and it’s exactly why spirometry sometimes needs backup from other tests before restriction gets confirmed.
What Counts as a Positive Bronchodilator Response?
Bronchodilator testing checks whether your airway narrowing improves with medication, which helps distinguish asthma from more fixed forms of obstruction like COPD. The protocol is straightforward: you perform baseline spirometry, inhale a short-acting bronchodilator, wait roughly 10 to 15 minutes, then repeat the test.
Statistic Callout: A positive, or reversible, response is commonly defined as an increase in FEV1 or FVC of at least 12% and at least 200 mL from your baseline value, according to guidance in the American Family Physician spirometry review. Some guideline bodies apply slightly different thresholds or emphasize percent predicted change instead, so ask your provider which standard your report used.
- A significant improvement after bronchodilator suggests reversible airway narrowing, which supports an asthma diagnosis
- Little to no change points toward fixed obstruction, more typical of COPD
- Partial reversibility is common and doesn’t rule out either condition on its own
Reversibility testing doesn’t diagnose asthma by itself, but it’s one of the more useful clues your provider has for separating asthma from COPD when both present with similar baseline numbers.
How Severity Grading Works and Why Trends Matter More
Once a pattern is identified, severity typically gets graded using your FEV1 percent predicted. Mild obstruction generally falls above 70% predicted, moderate lands between roughly 60% and 69%, moderately severe between 50% and 59%, severe between 35% and 49%, and very severe below 35%, though exact bands vary slightly by clinical scale used.
A single result matters less than the direction it’s moving. If your FEV1 has dropped 10% from your reading a year ago, that decline carries more clinical weight than where you fall on a severity chart today.
- A stable FEV1 over repeated tests generally supports continuing your current treatment plan
- A steady downward trend often prompts a medication adjustment, additional imaging, or specialist referral
- A sudden, sharp drop between visits deserves prompt evaluation rather than waiting for the next scheduled test
Tracking these numbers over months or years, not just reading one printout in isolation, is how conditions like COPD and interstitial lung disease actually get managed. The NHLBI’s guidance on COPD diagnosis reflects this same emphasis on monitoring over time rather than relying on a single spirometry snapshot.
When You Need More Than a Spirometer vs Peak Flow Test
Spirometry answers a lot of questions, but not all of them. When your FEV1/FVC ratio and volumes suggest restriction, your provider often needs lung volume testing, specifically total lung capacity (TLC), to confirm it, since spirometry alone can’t distinguish true restriction from pseudorestriction caused by air trapping.
- Suspected restriction: TLC measurement via body plethysmography confirms whether your lungs are genuinely smaller than expected or just trapping air during forced exhalation.
- Unexplained breathlessness with normal spirometry: DLCO (diffusing capacity) testing checks how well oxygen crosses from your lungs into your bloodstream, catching problems spirometry can miss entirely.
- Suspected asthma with normal baseline spirometry: Bronchoprovocation testing deliberately triggers mild airway narrowing to unmask hidden reactivity.
- Persistently abnormal or worsening results: Referral to a pulmonary function testing program for comprehensive testing and specialist review.
A spirometer vs peak flow meter comparison matters here too. Peak flow meters are handheld devices useful for daily home monitoring of known asthma, but they measure only your peak exhalation speed, not the fuller picture spirometry provides. They’re a monitoring tool, not a diagnostic one.
What Happens During and After Your Spirometry Test
Most patients receive their reported results within a few days, though your provider may discuss preliminary findings the same day if the equipment generates an immediate printout. Spirometry is a safe test, but pushing out air forcefully can cause brief lightheadedness or dizziness for some people. Contact your provider if you feel unusually unwell afterward or haven’t heard back about results within the expected window.
A few preparation steps improve your odds of a valid test on the first try:
- Avoid smoking for at least an hour before testing, and ideally longer
- Skip bronchodilator inhalers before the appointment if your provider asks you to, since they affect baseline readings
- Wear loose clothing that doesn’t restrict your chest or abdomen
- Avoid a heavy meal right before the test, since a full stomach makes deep breathing harder
Following your provider’s specific instructions, including which medications to hold and for how long, does more to improve your results than almost anything else in the process. Reviewing practical lung health habits beforehand can also help you understand why certain preparation steps matter.
How Garden State Medical Group Approaches Spirometry and Follow-Up Care
Spirometry is integrated into broader cardiopulmonary diagnostic services, rather than treated as a standalone test disconnected from the rest of your care. Results get reviewed alongside your medical history, physical exam, and any prior lung function data, which is exactly the layered approach that produces more reliable interpretations than a printout alone.
Patients coming in for testing should bring:
- A list of current medications, especially inhalers or anything affecting breathing
- Notes on recent respiratory symptoms, including when they started and what makes them worse
- Any prior spirometry or pulmonary function reports for comparison
For patients whose results point to asthma, COPD, or another chronic lung condition, the group’s Lung Health Program provides structured follow-up, including repeat testing to track trends rather than relying on a single visit’s numbers. That continuity is what turns one spirometry report into an actual management plan.
Why Context Beats a Single Number Every Time
Spirometry numbers tell a clear story, but only when they’re read alongside everything else about the patient in front of you. Two people can post nearly identical FEV1 percent predicted values and need completely different treatment plans, because one has a rising trend and the other a falling one, or because one’s symptoms match the numbers and the other’s don’t.
Quality coaching during the test matters more than most patients realize. A poorly coached maneuver produces numbers that look like disease when the real issue was technique. That’s why repeat testing, done properly, so often changes the clinical picture entirely.
If you walk away from your results with more questions than answers, ask specifically: was my test reproducible, which reference equation was used, and how do these numbers compare to my last test? Those three questions get you a far more useful conversation than simply asking “was it normal.”
— Garden State Medical Group
Schedule Pulmonary Function Testing With Garden State Medical Group
If you’ve read this far wondering whether your own lung function needs a closer look, On-site cardiopulmonary diagnostics can go beyond a single test date, with results reviewed in context alongside primary care history to build follow-up plans based on identified trends.

Testing here means your cardiopulmonary care team, your primary care provider, and, when needed, our chronic care management program all work from the same set of results rather than starting from scratch at each visit. That coordination matters most for conditions like COPD and asthma, where trends over time drive treatment decisions far more than any single reading.
If your last spirometry left you with unanswered questions, or you haven’t had lung function testing in a while, consider scheduling a pulmonary function test with a provider who reviews results in the context of your full health picture.
This article is general information, not a substitute for advice from a qualified doctor. Consult a qualified healthcare professional about your own circumstances before acting on anything here.
Sources
- Pulmonary Function Tests - StatPearls - NCBI Bookshelf
- Global Lung Function Initiative reference equations (GLI 2012) - PMC
- An Approach to Interpreting Spirometry | AFP
FAQ
How Do I Read My Spirometry Results?
Start with your FEV1/FVC ratio compared to the lower limit of normal for your age, sex, height, and ethnicity, then check your FEV1 and FVC percent predicted values to gauge severity and pattern.
What Is a Normal Spirometry Result?
A normal result generally means your FEV1/FVC ratio and your FEV1 and FVC percent predicted values all fall above the lower limit of normal for your demographic group, rather than matching one fixed number for everyone.
How Do I Interpret Spirometry Results for Obstruction vs Restriction?
A low FEV1/FVC ratio relative to the LLN points to an obstructive pattern, while a normal ratio paired with reduced FEV1 and FVC together suggests a restrictive pattern that often needs lung volume testing to confirm.
What Is Considered Poor Lung Function on Spirometry?
Poor lung function typically shows up as an FEV1 percent predicted below roughly 70%, with more severe reductions below 50% generally indicating moderately severe to severe impairment, though the specific bands used vary by clinical scale.
Can Garden State Medical Group Help If My Results Look Abnormal?
Yes. Garden State Medical Group’s cardiopulmonary diagnostics team reviews abnormal spirometry results alongside your medical history and can coordinate follow-up testing or ongoing management through its Lung Health Program.